Nowadays there is a lot of talk about data and the different ways you can take advantage of it to get all kinds of analytics and the different approaches that range from basic reporting to data self-service tools or even advanced algorithms and artificial intelligence.
What nobody talks about, however, is the quality of data that is required to obtain good results from all of these processes.
This article aims to be a basic guide on how to measure and quantify data quality, regardless of how and where this data is being stored:
- Key Facts around Data
- Secret Data Factories
- Garbage In Garbage Out
- How Can I Measure Data Quality?
- Monetize: 1, 10, 100 rule
- Acceptable Quality Values
Key Facts
The article “Bad Data Costs the U.S. $ 3 Trillion Per Year” by Thomas C. Redman published in the Harvard Business Review cites manufacturer data, such as the following:
“$3.1 trillion, IBM’s estimate of the annual cost of data of poor quality, only in the United States in 2016.”
“84% of CEOs are concerned about the quality of the data they’re basing decisions on.”
When there is a lack of confidence in the quality of the data, the confidence in the results is quickly lost, which causes subsequent obstacles and motivation to obtain greater information management initiatives, especially in data that is key to investment.
Join our freelancer community today!
Create your profile in just 2 minutes and start attracting new clients.
Secret Data Factories
As a personal judgment, I would dare to say that all companies have their own secret data factory in one or more areas, even if it is a tiny one.
What I refer to as a “secret data factory” is what is shown in the chart below, that is, the set of additional, non-formal processes of validation, correction, and homologation of data in an area of business in order to obtain a final data set that meets your needs to generate analysis, knowledge, and value.

In these factories are workers who pay condemnation as they must invest extra time (commonly called “junk time”) in operational work that generates unnecessary costs.
Such data factories are expensive and are part of the $3.1 trillion per year that IBM refers to the article we mentioned earlier.
Unfortunately, this reality is underestimated or ignored by managers for various reasons:
- Sometimes the middle managers do not show them since they are not aware of the expense that they represent
- Managers have come to consider it part of their team’s work to avoid confrontations with other areas
- They consider it part of departmental effectiveness
- There is a lack of inter and extra-departmental communication
Whatever the reason is, managers should become more interested in organizational costs and begin to see data as the basis for decision making at all levels.
Let’s see some data obtained from the same article mentioned before:
- 50% is the amount of time that knowledge workers waste hunting for data, correcting errors and trying to find sources for shifty pieces of data
- 60% is an estimated fraction of time that data scientists need to clean and organize data, according to CrowdFlower.
- 75% is an estimated fraction of the total cost associated with secret data factories in simple operations, which are based on the “Friday afternoon measurement” and/or “the rule of 10” technique.
Later in this article, I will explain “the measurement of Friday afternoon” raised by Redman and the rule of 1, 10, and 100, a separate monetization technique.
Garbage In, Garbage Out
According to Wikipedia, the popular term “Garbage In, Garbage Out” was used for the first time in November 10, 1957, and described the fact that the performance of a computer was only as good as its input. Sixty years later the term is widely applied to the quality of organizational data.
An alternative to this term is ‘Garbage In, Gospel Out‘, which best describes the reality of organizations where the generated data is accepted “blindly” without further analysis, as the process of how they were generated is unknown.
One question that I regularly ask in my presentations is if anyone has ever asked for the percentage of quality for a particular report they obtained.
Something like “Juan your report is ready, the information contained has 68% quality.” Nobody? Unfortunately in auditoriums of up to 400 people, nobody has ever raised their hands.
The example above hypothetically could mean that our decisions do not have a certainty greater than 68% and that we should act with caution since there is a latent risk.
How Can I Measure Data Quality?
There are different options that range from algorithms in languages such as SQL to tools for analysis and profiling of data.
If we do not have tools or want to try other ways, Thomas Redman, president of Data Quality Solutions proposes a simple 4-step method called “measuring Friday afternoon,” which can help almost any person, division or company to measure the current level of data quality and develop a high-level estimate.
It’s more than a profiling process that reviews formats and frequencies, or an audit that reviews punctual data, frequencies, and percentages of impact.
I see it as a kind of hybrid method based on the obviousness that data is correct or incorrect, applying common sense and general business rules.
The proposed steps are:
- Obtain the last 100 data records that your team used or created. For example, if your team takes customer orders, use the last 100 orders; If you generate policies, use the last 100 policies. Then concentrate on 10-15 elements or critical data attributes of each record. Put them on a spreadsheet and project them or use large sheets of paper.
- Meet with two or three people who know about the data. These meetings take approximately 2 hours, so it is common to do them on Friday afternoon when work normally slows down.
- Work record by record. Ask your colleagues to mark the obvious errors in a remarkable color (red or orange). For most records, this will be extremely fast; team members will probably detect errors such as a customer’s misspelled name, data that was placed in the wrong column, incorrect formats, out-of-range values , or garbage entered to evade control. In some cases, there will be debates about whether an item is really wrong, which generally won’t last more than 30 seconds.
- For each record, add a column that indicates whether the record is completely correct or not. Check “YES” if there is no error and “NO” if red or orange appears in the record.
A table that looks a lot like the figure below will be generated:
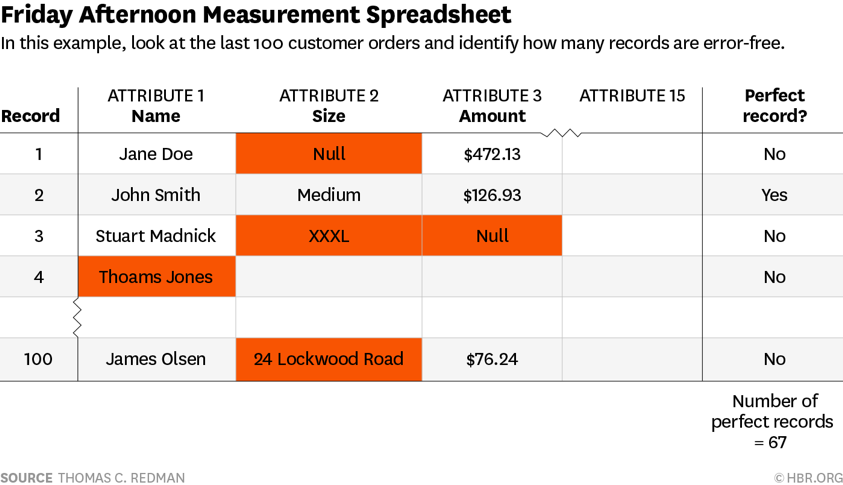
Totalize the “number of perfect records” as seen in the example. Of the last 100 records in our data set, we only have two-thirds complete: 67 out of 100 records in an adequate manner.
As I mentioned previously, by applying this method you can have a general idea of the data quality of a specific data set. Looking past just data, however, for the sake of the business, it is always important to monetize these findings.
A Step Further: Monetize It
My recommendation is to use the rule of 1, 10, and 100. This is a concept of quality management developed by George Labovitz and Yu Sang Chang in 1992 that is used to quantify the hidden costs of poor quality.
When relating the concept to data quality, it must be recognized that a general principle will be applied instead of exact numbers.
How does it work? The rule applied to the data is the following:
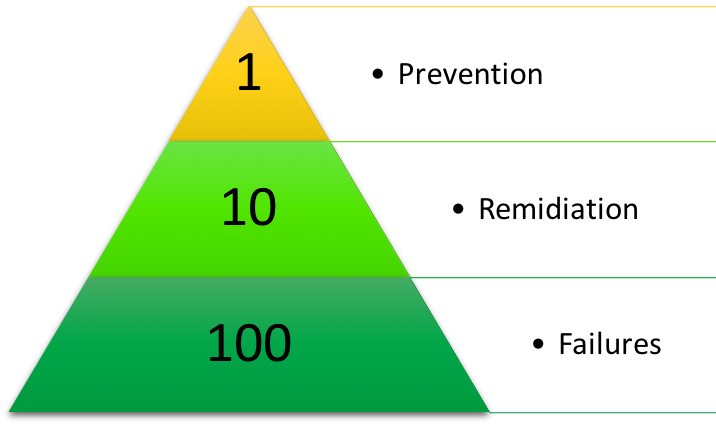
- Prevention: Stop the entry of incorrect data to the system has a cost of $1 USD per registration. This is known as the cost of prevention; verify it at the time of admission.
- Remediation: Cleaning and duplicating a record costs approximately $10 USD to the business. These correction costs may be obvious; for example, we can establish teams that are responsible for validating and correcting errors where we would otherwise be spending money to virtually capture the data twice.
- Failures: Working with a record that never gets cleaned costs $100 USD. This is the cost of maintaining data failures.
Remediation costs are negligible when compared to the costs of leaving the wrong data in place.
Poor data quality affects the organizational capacity to operate.
- If we bill the wrong amount, then we’ll not get paid.
- When we deliver to the wrong address, then we have to pay for another delivery.
- If we provide an incorrect risk assessment, we increase our chances of bad debt.
That is why our focus should be on prevention as much as possible.
Let’s see this with a simple example:
If a record was inserted into the database on July 25, 2018, it cost the company about $1 to verify it at that time and could take 1 minute to review it and correct it if needed.
This is your prevention cost, which may involve checking the address against a basic services form, the tax declaration, making sure that the client’s name is correctly written, and making sure that the client has not already appeared in the database.
During a data quality initiative, a record is corrected, that is, it is updated to the real quality that it should have at the beginning.
This is the cost of correction, which is ten times the effort and involvement of a person to have to call the customer, consult their data, request documents, search in different sources, perform manual updates, among others. It’s often a necessary part of data maintenance.
If that record is never checked and cleaned, nor is it never restored to its true quality, this will cost the company 100 times as much as the initial expense.
Why? Because it creates waste.
Its effects spread through the business, as the wrong data causes more work and chaos, thus the business becomes disorganized and cannot operate efficiently. Most importantly, the effects of this waste translate into losses, both in terms of money and time.
Please note that the 1,10 and 100 rule does not consider the collateral effects of poor data quality such as unsatisfied customers and staff. These are additional costs that are harder to measure and are more subjective from company to company.
Conclusion: Which Values Are Acceptable?
As in any quality process, the more investment of time, the higher quality, but the relationship between the two variables is not arithmetic, rather logarithmic. That is, the Pareto principle of an 80-20 ratio is fulfilled.
As effort increases, the margin for improvement is getting smaller. 100% data quality is usually technically and economically unfeasible. Mistakes are inevitable.
As an example, NASA is probably the corporation that invests most resources in quality processes worldwide. Each piece is rigorously revised, however, there are still errors, some of them with fatal consequences.
In the data quality programs, the same thing happens, so it is important to balance effort and quality.
You must find the inflection point depending on the type of business, field, variable, or attribute. It is ideal not to invest too much money and effort in complex rules that at the end of accounts no greater contribution. Make your money work for you and figure out what elements need more investment than others.
What do I mean? To give an example, I have worked with clients who wish to instill a quality rule so detailed and so thought-out that it solves errors on 150 records that equate to 0.61% of the quality of an attribute or field.
In these specific cases, it is better to make manual corrections that have a high investment cost, as automating a quality check for 150 records that might be used once will be much more costly than just having one or two employees check the records themselves.
For the initial example, and as a reference, I can say from experience that 67% quality is a fairly acceptable value in general terms, regularly in this type of project reaching and maintaining over 80% quality is considered a real milestone.
Everyone in an organization should make data quality a part of their work, and this exercise provides an easy way to take action towards improvement.
This process is not intended to be a one-time exercise, but rather to become a permanent data quality routine. Once you know that you have problems with the data and also know the cost associated, you can start making real improvements!

Looking to hire a skilled freelancer? Create your account in just 2 minutes and start connecting with top talent worldwide!
Sign up for free