Recruiting KPIs (Key Performance Indicators) are an effective tool for measuring and evaluating the recruiting process. Thanks to recruitment KPIs and metrics, recruiters can find the potential for improvement in their tasks, leading to a highly optimised hiring process. Besides obvious KPIs such as the number of applications per year or per position, there are other important key performance indicators that can help reach the ideal candidate in the best possible way.
The combination of recruiting and controlling brings many advantages for your company. In this article you will find out how recruiting KPIs can help you with process optimization.
- Recruiting KPIs
- Recruitment KPIs examples
- KPI strategy to Increase Recruitment Efficiency
- Talent acquisition analytics
- Conclusion: Use recruiting KPIs sensibly
Recruitment KPIs – Checklist
As stated above, recruiting KPIs are an effective tool for measuring and evaluating the recruiting process. But where does one begin when figuring out what the best metrics to track are? Don’t worry, it doesn’t have to be complicated!
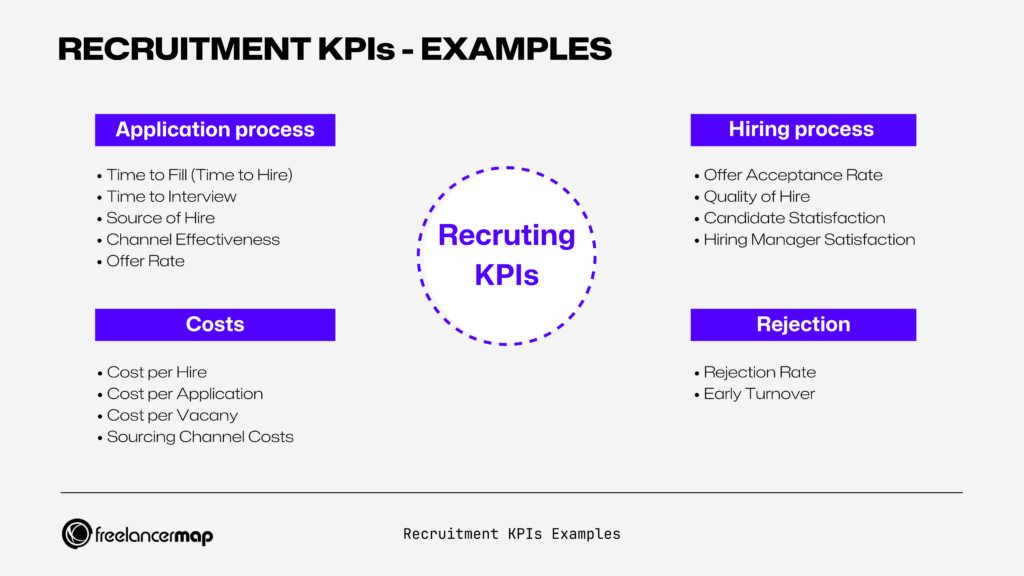
There are a few obvious ones that you’ll need to track as well as other key figures that will allow you to source the best possible candidates. Let’s take a look at some of these down below:
Application Process
| Time to Fill (Time to Hire) | Time from posting the vacancy to filling the position |
| Time to Interview | Period of time from the job advertisement to the first introductory meeting |
| Source of Hire | Ratio of the number of applicants to the recruiting channel |
| Channel Effectiveness | Indicates how effective the individual recruiting channels are |
| Offer Rate | Ratio of job offers to relevant applicants |
| Application Completion Rate | Ratio of candidates who start filling out applications to candidates who actually complete and submit an application |
Hiring Process
| Offer Acceptance Rate | Percentage of candidates accepting a job |
| Quality of Hire | Quality of new hires |
| Source Quality | Quality of the candidates from different sources |
| Qualified candidates per opening | Ratio of qualified candidates per position |
| Interviews to Hire | Number of applicants to interview to get one suitable candidate |
| Candidate Satisfaction | Applicant satisfaction with the process |
| Hiring Manager Satisfaction | Satisfaction rate of recruiters with the existing recruiting process |
| Adverse Impact | Ratio between people who are hired from a protected class and people who are hired from a non-protected class |
Costs
| Cost per Hire | Costs for staffing |
| Cost per Application | Cost per application |
| Cost of Vacancy | Cost of a vacancy |
| Sourcing Channel Costs | Costs of a recruiting channel in relation to the return of applicants |
Rejection
| Rejection rate | Applicant share that reject the offer immediately |
| Early turnover | Share of applicants that leave after the onboarding phase |
| First-year Turnover Rate | Applicants that leave within a year of accepting the offer |
Recruitment KPIs examples
#1 Application process
1. Time To Fill/ Time-to-Hire
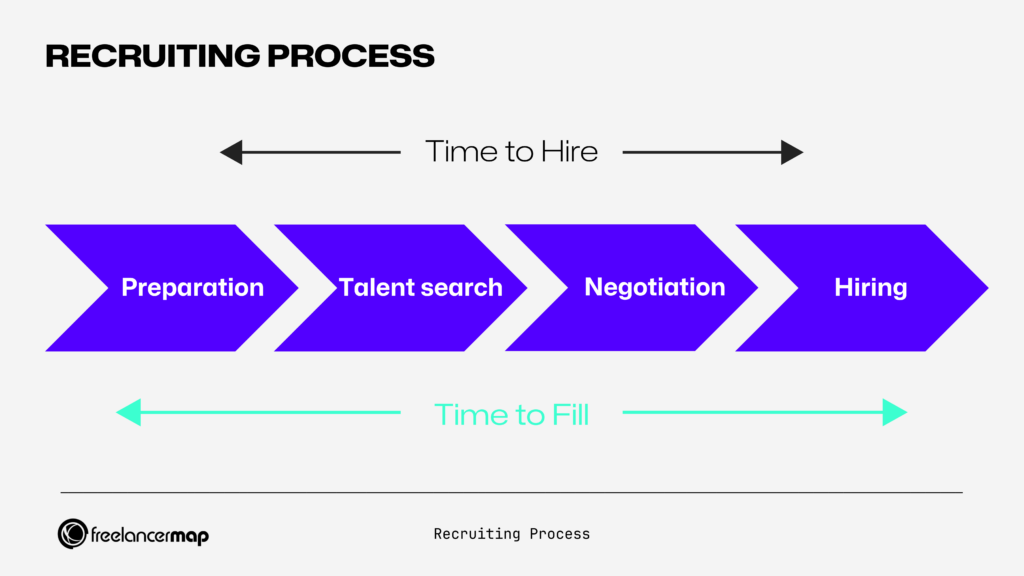
These key figures track the duration of the recruiting and application process. They are often used interchangeably but mean different time periods.
Time to Fill describes the period of the entire recruiting process. Starting with the insight that a position has to be filled (e.g. through a termination), through the publication of the job advertisement, the application process, to the hiring. This allows you to control the duration and quality of your entire recruiting process.
The Time to Hire only includes the application process from the applicant’s perspective. The period of time between an application received and the job offer or acceptance is considered. The Time to Hire is therefore closely linked to the customer experience.
Long application processes result in a long Time to Hire and ultimately in a shortage of skilled workers. To speed up or avoid this, you should take a closer look at your recruiting process:
- Are your job advertisements and the selected recruiting channels meaningful?
- How quickly do you process incoming applications?
- Are you reaching the right applicants for your position?
- Are your applicants satisfied with the application process?
2. Time To Interview
This KPI refers to the period of time from the advertisement of the position to the first introductory interview with an applicant. This KPI is directly related to the speed of your application processes. Therefore, it can also be used as an indicator for the candidate experience, which in turn is related to the candidate satisfaction.
So, if you receive attractive applications, make sure that they are processed quickly and that you receive quick invitations to an interview. This creates a positive impression on the applicant and enables faster access to the best candidates.
3. Source of Hire
The Source of Hire indicates the recruiting channel through which the new employee became aware of your company. You can also use it to generally track through which channels interested parties apply. Examples of this are job exchanges, active sourcing, programmatic advertising, social media, trade fair appearances or your own career page.
4. Channel Effectiveness
Channel Effectiveness indicates how effective the individual recruiting channels are. From this one can deduce whether the channel will bring the hoped-for success or not.
This key figure can be evaluated, for example, with Google Analytics, campaign tracking and the evaluation of dashboards. So-called online tracking gives you a precise overview of the views of a job advertisement on a channel. You can also track how many times the apply button has been pressed. If these two values are far apart, you have probably reached the wrong target group.
5. Offer Rate
The Offer Rate describes how many candidates there are for a specific position and how many applicants have been offered a job. You put applicants and job offers in relation and do not yet consider whether there will actually be a replacement.
6. Application completion rate
The Application Completion Rate KPI allows you to compare the number of candidates who start filling out applications vs candidates who actually complete and submit an application. This is an important KPI because it gives you insight into how complex or simple your application process is.
The equation for Application Completion Rate is quite simple and is as follows:
Application Completion Rate = No. of submitted applications / Total No. of applications started
#2 Hiring process
1. Offer Acceptance Rate
The Offer Acceptance Rate (OAR) goes one step further and compares how many applicants actually accepted the job or dropped out after being accepted. This recruiter KPI is used to determine the percentage of actual commitments. It provides information about how attractive a job advertisement or a company is for applicants and how successfully a company fills its vacancies.
Calculation of the Offer Acceptance Rate:
OAR = (Number of Job Offers Accepted / Number of Job Offers) x 100
The offer acceptance rate in your company should always be above 80%. Because that means that the requirements of the recruiters go well together with the expectations of the applicants. If the OAR is below this value or is falling steadily, recruiters should take measures to optimise the candidate experience.
2. Quality of Hire
The Quality of Hire indicates how well a new employee really fits their position. So you measure the quality of the new hires here. It looks at whether the newly hired employee has contributed to the success of the company in a certain period of time. If you have a high-quality employee, you can also speak of high quality in the recruiting process.
So that means: the higher the quality of the new hires, the more precisely the recruiting process was carried out and the desired target group was reached. The quality of hire can also be easily combined with channel effectiveness. In this way, recruiters can find out which channels bring not only the most, but also the most suitable applicants.
3. Candidate Satisfaction
The Candidate Satisfaction means applicant satisfaction. This key figure provides information on how satisfied the candidates are with the application or hiring process. It is important that Candidate Satisfaction is high. Because the happier the candidates are, the longer and more motivated they will be in the application process. So it becomes less likely that they will jump off on their own. Candidates will probably even recommend their company to others, even if they don’t end up being hired.
To find out how satisfied your applicants are, you simply have to ask them: With the help of personal feedback discussions, you can find out how the candidates feel. But you can also find out a lot about CS on platforms where employers are rated, such as Glassdoor and Indeed.
4. Hiring Manager Satisfaction
Not only is the satisfaction of the applicants important, recruiters should also be happy with the application process. Therefore, the Hiring Manager Satisfaction indicates the satisfaction rate of recruiters with the existing recruiting process.
To determine this key figure, companies only have to survey their recruiters and employees of the application process. For example, you can provide information about the workflow, the recruiting process or the candidate and provide concrete suggestions for improvement.
5. Qualified Candidates Per Opening
The Qualified Candidates per opening KPI is one of the best metrics to track and refers to the average number of candidates that were found to be properly qualified during the hiring process for each job category.
This KPI is crucial to your sourcing and recruitment strategy and can help you identify any discrepancies.
6. Source Quality
The Source Quality KPI allows you to ensure that you’re not wasting your time on a source that isn’t giving you high-quality candidates in return. For example, if you’re sourcing candidates from referrals, networks, and databases and only referrals and databases are actually giving you qualified candidates, then your time is better spent on these two sources.
This KPI allows you to build an effective and reliable recruitment pipeline and improves your strategy as a whole.
7. Interviews to Hire
Just like the Source Quality KPI, the Interviews To Hire KPI allows you to glean whether you’re using your time effectively. Because interviewing can be complicated and time-consuming, it’s important to know if the people you interview actually make it to the hiring stage and if so, how many.
This KPI can help you understand just how many candidates you need for an opening and how many you’ll need to interview.
8. Adverse Impact
The Adverse Impact KPI allows you to identify whether any bias exists in the hiring process against certain protected classes. For example, if a woman is hired with an Adverse Impact rate of less than 80%, there is an indication that there is a bias present.
Measuring this KPI begins first by dividing the candidate success rate into 2 groups: Group 1 being protected class and Group 2 being non-protected class. Dividing Group 1 by Group 2 gives you your Adverse Impact score.
#3 Costs
1. Cost Per Hire
Cost per Hire describes the average costs incurred when filling a position. This key figure is calculated from the sum of the internal and external recruiting costs, which is then divided by the number of new hires in your company. This also makes it easy to estimate the recruiting budget.
Formula for calculating the Cost per Hire:
CpH = (internal costs + external costs) / number of positions filled
Example:
– Internal recruiting costs: 14,000 euros
– External recruiting costs: 10,000 euros
– 20 positions filled
(14,000 euros + 10,000 euros) / 20 = 1,200 euros = CpH
Result: The cost per hire is 1,200 euros. For example, if 30 positions need to be filled in one year, you should plan a recruiting budget of 36,000 euros (= EUR 1,200 x 30).
The lower the costs, the more efficient the recruitment process within a company. Therefore, Cost per Hire is a meaningful recruiting indicator.
2. Cost Per Application
This recruiting KPI (CpA) describes the costs that are incurred on average for an application. It is calculated by dividing the costs for placing job advertisements and other personnel marketing costs by the number of applications received. It makes sense to break down the CpA into different departments, job descriptions or channels. Only then do you have meaningful comparative values.
Formula for calculating the cost per application:
CpA = (cost of the job ad + recruiting costs) / number of applications received
3. Cost Of Vacancy
Cost of Vacancy (CoV) describes the costs incurred by a company if a position remains vacant. It is assumed that a company with a lack of manpower makes losses because tasks cannot be completed. At the same time, this means that a worker generates money for the company, which, according to the CoV, does not materialise.
This metric is calculated by dividing the annual salary of the vacant position by the number of working days in the year. Depending on the economic importance, the salary per working day is then divided into a factor of 1, 2 or 3. Then you multiply that amount by the number of days it takes to fill the position.
Sample calculation:
– Unfilled Head of Marketing position
– Annual salary: around 100,000 euros
– Annual Working Days (AT): 251
– Factor: important economic importance = 3
100,000 euros / 251 AT = approx. 398 euros -> 398 euros per day x 3 = 1,194 euros per day = CoV
Result: The company has lost sales of 1,194 euros per day due to the lack of employees. The CoV shows how essential it is for the company to fill a specific position.
4. Sourcing Channel Costs
The Sourcing Channel Costs puts the costs of a recruiting channel in relation to the applicant response. This allows companies to determine which channels cost how much and to how many applications they lead to. From this it can be deduced which channels deliver the most applicants and which ones they should concentrate on. For channels with low returns and high costs, recruiters should review their job postings for errors or discontinue the channel.
Example: freelancermap vs. classic job exchange
Companies pay an average of 1,500 euros per month for an effective online job advertisement. The number varies between 400 euros and 2,000 euros depending on the job exchange and individual posting or multi-posting. At freelancermap you can find suitable talents from 59 euros per month without a placement fee. In our example, we assume 15 applications received in one month per channel:
Job exchange: 1,500 euros / 15 = 100 euros
freelancermap: 59 euros / 15 = 3,90 euros
Result: The Sourcing Channel Costs can vary greatly depending on the platform. The lower these are, the more effective the selected recruiting channel is. While you usually pay for each online placement of a job advertisement on the classic platforms, there are alternatives where you only have to pay a basic monthly fee. This automatically minimises the costs.
#4 Rejection
1. Rejection Rate
If you sort out an applicant immediately after receiving their application, they will fall into your company’s rejection rate. One reason for this is, for example, if the applicant does not meet the minimum requirements that you have set in advance. The rejection rate provides information on whether you are reaching the right applicants with your job advertisement. It also says something about the effectiveness of your job advertisement.
If you notice a high rejection rate, you are not reaching the desired target group. Therefore, think about your job advertisement and check whether it contains all the necessary information for the applicant. The wrong recruiter channel also has a major impact on the rejection rate.
2. Early Turnover
Early turnover indicates the number of employees who leave the company shortly after being hired. This often happens before they are fully onboarded, i.e. during onboarding. Since the application process is very cost- intensive for companies and it starts all over again after early fluctuation, this should be avoided. Therefore, onboarding processes should be well structured and motivating for new employees.
3. First-Year Turnover Rate
First-Year Turnover Rate is one of the most important KPIs that you can use to improve the efficiency of your recruitment strategy. This is because turnover rates have been known to have a lasting effect on the success of any organisation and is therefore just as important as financial or other customer-centric KPIs.
The formula for calculating the First-Year Turnover Rate is as follows: simply divide the total number of employees who leave in less than a year by the total number of employees who leave during the start of the measurement period.
KPI strategy to increase recruitment efficiency
Recruiters with a KPI strategy can streamline their recruiting process. For this purpose, relevant key figures must be selected and collected. Before that can happen, however, companies must analyse their current situation.
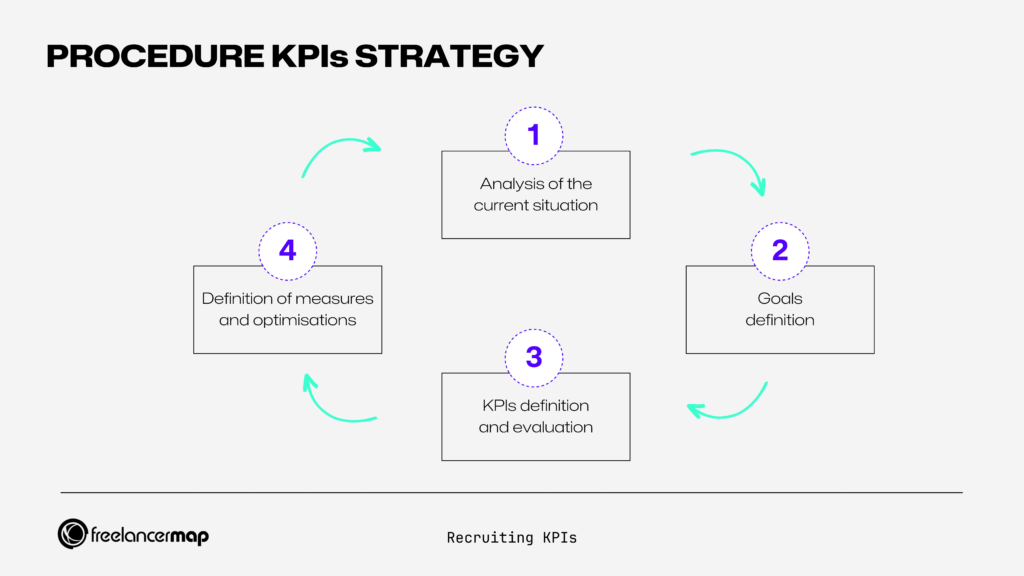
1. Analysis of the current situation
Ask yourself the following questions about your current application process:
- What is our current recruiting situation ?
- How does our recruiting process work?
- Do we have a sufficient and high-quality response from applicants?
- What are our corporate goals?
- What are our recruiting goals ?
- How can I achieve our corporate and recruiting goals?
2. Definition of the recruiting goal
For a good recruiting process you need a goal. This must be based on your company goal and be measurable. So define a goal that you can pursue by tracking the KPIs or key figures in recruiting, for example increasing the reach of your job advertisements. Use intermediate goals to check whether your measures are leading to the desired result.
3. Derivation of the key figures
Once you have defined your recruiting goal, you should now consider which key figures will help you to be successful. So only collect the KPIs that also fit your recruiting goal and are based on it. Clearly define which key figure says what in your analysis.
For example, the data can show you which channels are reaching how many candidates by looking at channel effectiveness or source of hire. For your recruiting process, it is also important to know what costs arise for which channel and whether these are bearable in relation to the reach achieved.
That is why the KPI Sourcing Channel Costs is also interesting. In this case, the quality of hire does not bring you closer to your goal and does not belong in this analysis.
4. Evaluation of recruiting KPIs
The recruiting KPIs collected must now be evaluated and collected over a specified period of time. Your key figures should be able to answer the following questions if your goal is to increase your reach:
- Which recruiting channel has the greatest reach?
- Which recruiting channel has the smallest reach?
- What is the reach in relation to applications received from this channel?
- What is the cost of a channel?
- Are the sourcing channel costs bearable in relation to the reach achieved?
- Should you continue, tweak, or shut down channels that are performing poorly?
5. Definition of the measures
The analysis of the recruiting key figures provides results that you should take into account in your further recruiting process for measures and optimisations. For example, if you conclude from your analysis that most and most suitable applicants come from career platforms such as LinkedIn, you should focus on this recruiting channel and adjust your budget accordingly. In addition, channels that show potential for improvement should be expanded and optimised.
Channels with little reach will not reach your target group. So you have to decide whether these will be turned off or whether there are gross errors that you can fix.
Talent acquisition analytics
Talent acquisition analytics refers to the process of analysing candidate data as well as various recruitment metrics with the sole intention of improving the recruiting and selection phase. Analysis is usually done through a tool such as an ATS (Applicant Tracking System), Excel, Google Analytics, etc.
Talent acquisition vs recruiting: what’s the difference?
Unlike the usual recruitment process, talent acquisition analytics occurs when companies are looking to fill in a skills gap in their organisation, improve their hiring journey, and meet business objectives.
It is a more intensive process than simply filling an open position because it is done with the organisation’s strategic goals in mind. The stakes are therefore much higher in talent acquisition when compared to regular recruiting.
Talent acquisition analytics: Metrics to track
Shown below are a few important and relevant Talent Acquisition analytics that you might want to track:
1. Time To Fill
This metric refers to the time it will take to fill in vacancies or job positions. While some jobs may be more difficult to fill than others, this time will help you determine just how quickly candidates are sourced, interviewed, and finally hired.
2. Time In Step
This KPI refers to the amount of time candidates spend during each step of the hiring process. This includes initial interviews, screenings, assessments, etc.
It’s important to analyse how much time each of the different steps or stages take and identify any bottlenecks that, when eliminated, can help improve the TA of a company remarkably.
3. Cost Per-Hire
Cost-Per-Hire, as mentioned above, refers to the different expenses incurred during the process of Talent Acquisition. These can be costs related to sourcing, relocating, travelling, etc. and can be calculated by adding up all the costs and dividing it by the number of new hires.
4. Quality Of Hire
The Quality of Hire KPI allows you to understand the value that new hires add to an organisation and is usually measured by the new hire’s performance, manager satisfaction level, and career progression.
5. Offer-Acceptance Rate
This KPI represents the number of hires who actually accepted the job vs those who were offered the job. A good Offer-Acceptance Rate is usually above 90% and is a general reflection on the overall hiring process.
Conclusion: Use recruiting KPIs sensibly
Every recruiting department and every company has to decide for itself which key figures can be useful for its recruiting. Because data collection and evaluation involves a lot of effort, thoughtless action brings little success for your recruiting. A balanced KPI system that serves the goals of your company is crucial. At the same time, your recruiting key figures should lead to concrete measures: Can you use the information obtained to optimise your application process and save costs, for example?
Applicant management software can help with tracking recruiter KPIs. Find out how best to set up and evaluate your database!
Take your recruiting process to the next level.
Create your account in just 2 minutes and start connecting with top talent worldwide!