A data visualisation developer is in charge of breaking down text-based data sets to create graphic representations. Their responsibilities include incorporating data quality considerations into visualisation planning, optimising reports to ensure responsive solutions, transforming and improving data, and more. What does a data visualisation developer do?
What is Data Visualisation?
Data visualisation refers to the graphical representation of information and data by use of visual tools such as graphs, charts, maps, and more.
The purpose of data visualisation is to make data easier to understand and gain insights from. Professionals working in this field are tasked with understanding and identifying patterns and trends in data sets and using it to help drive informed decision-making.
Data visualisation is a branch of data science and is crucial in almost any industry. It enables companies and businesses to get accessible data which translates to more opportunities to explore and inform actionable decisions.
Data visualisation is closely related to Business Intelligence (BI), as the latter focuses on the creation of reports and dashboards based on data mining and analysis to facilitate decision making.
However, both concepts are different as there are differences between BI tools and data visualisation libraries. The latter is fully customisable and more technically advanced (they are linked to a programming language).
Data visualisation tools (such as Vizipedia, DataViz or Word2vec) allow the company to identify trends, correct possible deviations or predict behaviour.
Below is a list of the elements which are commonly used for the visualisation of the data collected:
- Charts
- Graphs
- Maps
- Infographics
- Dashboards
However, more specific methods can be added to all of these to create more dynamic and customised presentations.
Data visualisation tools and libraries that are available
- Google Data Studio (basic for beginners)
- Power BI
- Tableau
- Plotly
- Bokeh
Get in touch with expert Data Visualisation Developers here!
Responsibilities of a Data Visualisation Developer
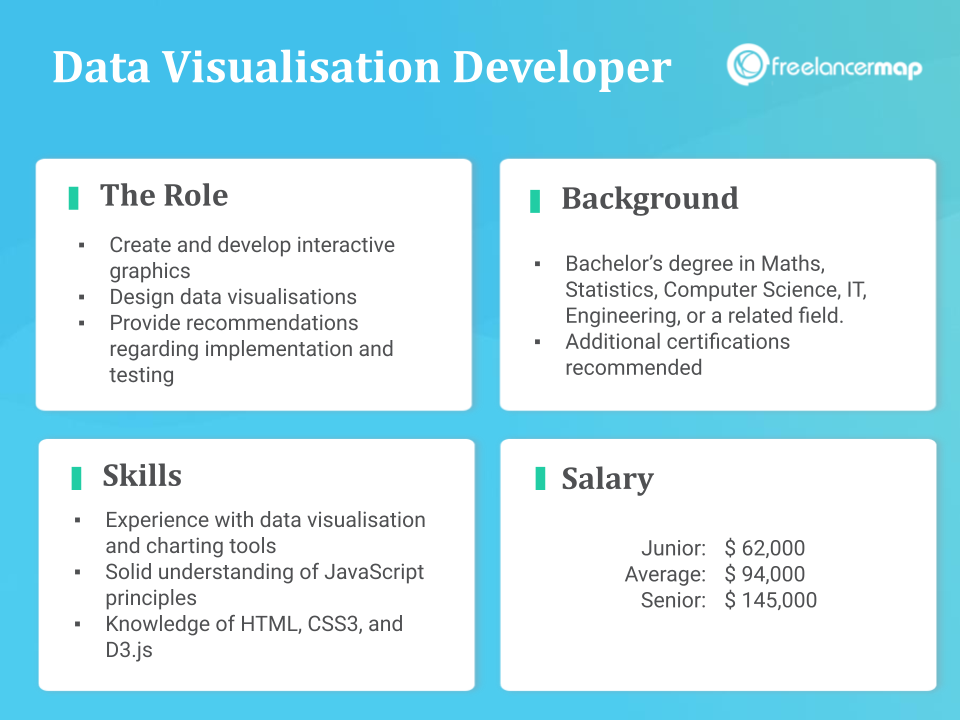
A data visualisation developer is in charge of creating interactive graphics, and designing and developing interactive data visualisations for organisations. They are also responsible for providing recommendations regarding implementation and testing.
Data visualisation developers work with data analysts to create analytical reports, and integrate multiple data sets. They make large and complex data more accessible, understandable and usable.
These developers are also tasked with developing data visualisation dashboards and provide thought leadership, best practices, and standards to deliver effective and sustainable solutions.
They also run recurring database queries, visualise and calculate metrics, and transform data sets and quantitative and qualitative analysis into compelling and effective visuals.
Data visualisation developers are also often in charge of providing production support and solving complex BI (Business Intelligence) challenges. They also have to make sure that all data is appropriately validated and that they are able to write robust front-end code using HTML, CSS and JavaScript frameworks and libraries.
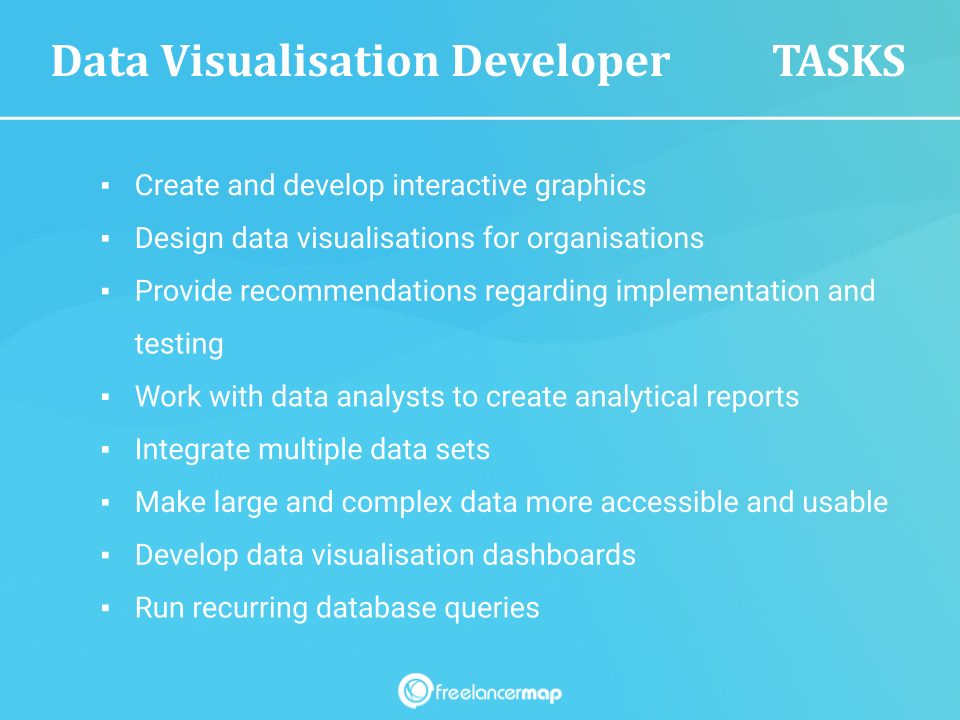
What do data visualisation developers do?
- Create and develop interactive graphics
- Design data visualisations for organisations
- Provide recommendations regarding implementation and testing
- Work with data analysts to create analytical reports
- Integrate multiple data sets
- Make large and complex data more accessible and usable
- Develop data visualisation dashboards
- Code user interfaces using HTML, CSS and JavaScript
- Provide standards to deliver effective and sustainable solutions
- Run recurring database queries
- Visualise and calculate metrics
- Enhance existing interfaces to improve layout, load time and functionality
- Transform data sets into compelling and effective visuals
- Provide production support
- Solve complex BI (Business Intelligence) challenges
- Ensure that all data is appropriately validated
Skills of a Data Visualisation Developer
Data visualisation professionals need to know how to design applications, understand neural networks, have UX skills and also know how to code.
It is generally expected that Data Visualisation Developers will have some practical experience of the data integration processes (ETL).
A data visualisation developer usually has experience with data visualisation and charting tools and a solid understanding of Object-Oriented JavaScript principles and design patterns.
They have knowledge of HTML, CSS3, and D3.js and expertise when it comes to web standards, cross-browser compatibility, and CSS-based design. They also have experience with data visualisation tools and libraries like Tableau, Vislt, ParaView, etc.
Data visualisation libraries go hand in hand with a programming language, the 3 most commonly used being R, JavaScript and Python, so knowledge in any of these languages would be necessary.
Developers have the ability to understand business needs and translate them into meaningful and immersive visualisations and dashboards. They are also familiar with BI tools such as Looker and PowerBI and have experience using SQL in a business environment, as well as other data platforms such as Teradata, Oracle or cloud solutions.
These professionals have strong presentation and communication skills and a sharp attention to detail.
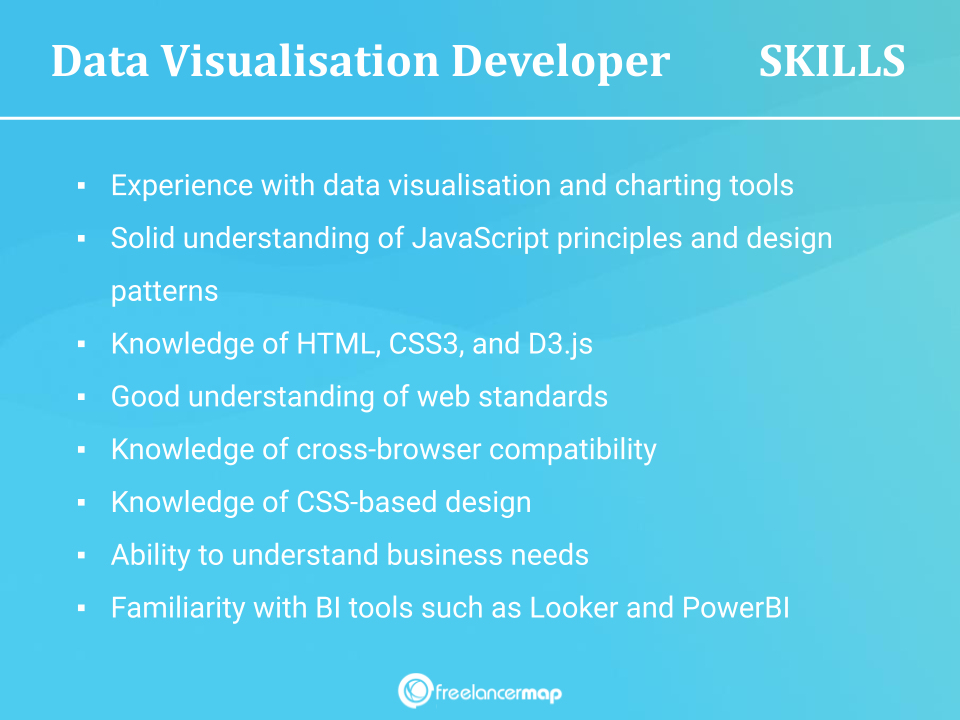
What are data visualisation developer skills?
- Experience with data visualisation and charting tools
- Solid understanding of JavaScript principles and design patterns
- Knowledge of HTML, CSS3, and D3.js
- Good understanding of web standards
- Hands-on experience with ETL, data ingestion, and data munging skills
- Knowledge of cross-browser compatibility
- Knowledge of CSS-based design
- Experience with data visualisation tools and libraries like Tableau and ParaView
- Ability to understand business needs
- Familiarity with BI tools such as Looker and PowerBI
- Experience using SQL in a business environment.
- Knowledge of JavaScript frameworks like Vue and Nuxt
- Strong presentation skills
- Good communication skills
- Attention to detail
Find Data Visualisation jobs here
Background and education
To work as a data visualisation developer, you technically need a Bachelor’s degree in a subject that develops your analytical skills. This could be Maths, Statistics, Computer Science, IT, Engineering, or a related field.
How do you develop visualisation developer skills?
You can also choose to obtain certifications to develop your visualisation developer skills and increase your knowledge further. Check out options for some of these courses down below:
- Complete Course in Data Visualization & Analytics
- Data Science: Visualization
- Data Storytelling and Data Visualization
- Python Data Visualization: Dashboards with Plotly & Dash
Join our IT freelancer community today! Create your freelance profile in just 2 minutes.
How much does a Data Visualiser earn?
A data visualisation developer earns $94,000 per year on average in the US. Those who are just starting out can expect a salary closer to $62,000 per year whereas those with advanced level of knowledge and skills can expect a salary of around $145,000 per year.
In Germany, the salary range for data visualisation developers is €58,000 – €101,000 whereas in the UK, the range is £30,000 – £70,000 per annual year.
In Spain, developers earn an average of €56,000 per year.
Salary range of data visualisation developers:
| US | $62,000 – $145,000 |
| Germany | €58,000 – €101,000 |
| UK | £30,000 – £70,000 |
How much do freelance data visualisation developers earn?
Data Visualisation Developer on freelancermap charge on average:
Rates in this field range between $40 and $96/hour for most freelancers.
The daily rate for Data Visualisation Developers (8 working hours) would be around:
Other interesting profiles
- What does a Data Warehouse Developer do?
- What Does An Ethical Hacker Do?
- What Does A Digital Forensics Analyst Do?
- What does a Knowledge Engineer do?
- What does an MIS Analyst do?
» More job profiles in Data Science & Analysis
Looking to hire a skilled freelancer? Create your account in just 2 minutes and start connecting with top talent worldwide!
Sign up for free